
Can you hear microsecond delays between the two ears?
Click on one of the sounds below to play a sound with a particular ITD. Then ask your participant whether the sound was on the right or left. If they are not sure, they must make their best guess.
Record their response using a table similar to the one below. Present each ITD once, making sure that you present different ITDs in a quasi-random order. Then repeat this process until you have at least 5 responses for each ITD tested.
Note: There is no need to test ITDs equal to +/- 400 microseconds unless your participant is unable to tell the difference between +/- 200 microseconds.

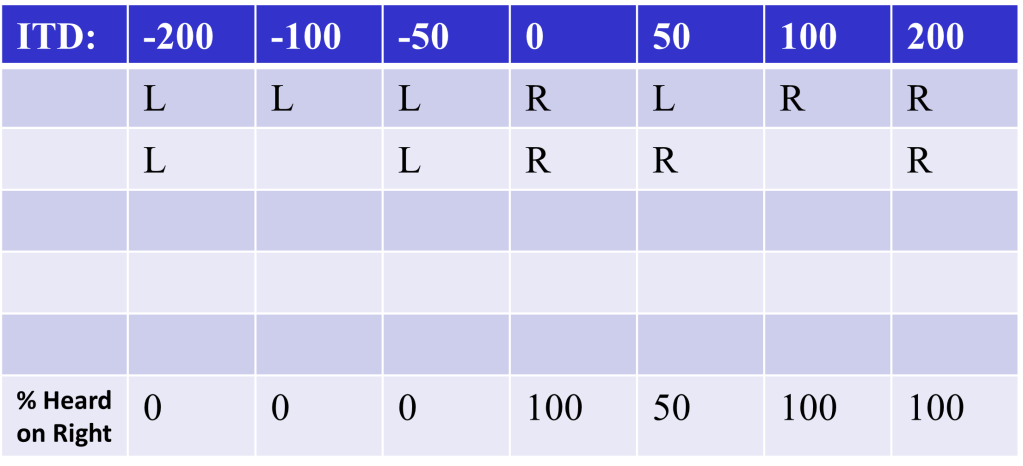
When you have finished collecting responses, calculate the percentage of sounds that your participant heard on the right. As indicated in the table above, do this separately for each ITD tested.
Then plot these percentage scores as a function of ITD and fit an S-shaped line. You can download an excel file below that will help you with this.
Once you have plotted your data, return to the workbook (section 3.2) to learn how to calculate the ITD threshold for your data and compare your data with the example in section 3.2 of the workbook.
