
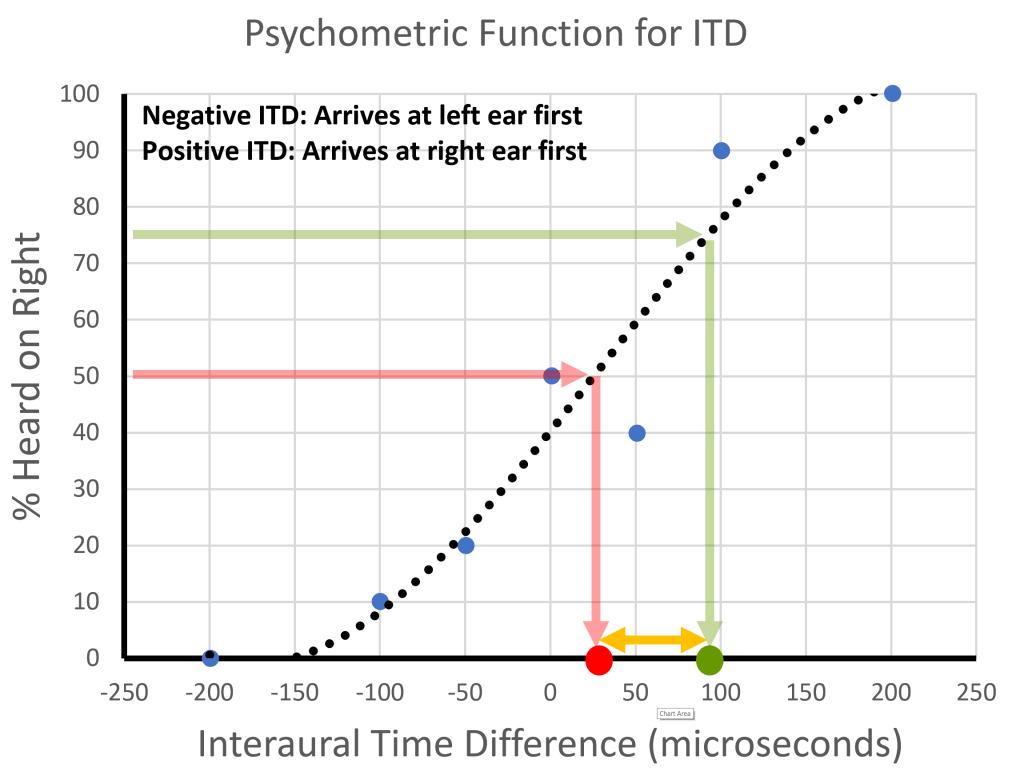
Plotting Data: For each ITD you tested, plot the percentage of times that the subject heard the sound on the right (blue circles). Then, fit an S-shaped curve to your data (black dotted line). You can download an excel file to help with this below.
50% Point: Identify the ITD that the subject hears on the right 50% of the time (red dot). This is the ITD that causes participants to guess randomly (i.e. 50% of the time they guess right and 50% of the time they guess left).
75% Point: Identify the ITD that the subject hears on the right 75% of the time (green dot). This is deemed to be a reliable rightward response because it is too consistent to reflect random guessing.
Worked Example:
50% Point (red dot; random guessing): 25 µs (microseconds)
75% Point (green dot; consistent rightward response): 90 µs
Threshold = 75% Point – 50% Point
= 90 µs – 25 µs = 65 µs
Threshold: Identify how much you have to change the ITD to go from random guessing (50% Point) to a consistent rightward response (75% Point). This is the threshold.
